RSS

Western Canada Recreational Property Market Outlook: What Buyers Should Know

The Western Canada recreational property market is entering a new phase defined by uneven performance, selective demand, and evolving buyer expectations. Rather than moving in one direction, the market is operating at multiple speeds, with softening conditions in some British Columbia regions, continued stability in luxury resort destinations, and strong growth in select Alberta markets.

This shifting landscape is creating different opportunities for buyers, sellers, and investors depending on location, price point, and intended use.

A Multi‑Speed Recreational Market Across Western Canada

Western Canada’s recreational real estate market is no longer driven by broad‑based momentum. Instead, performance varies sharply by region:

  • Some BC recreational markets are experiencing softer conditions, with elevated inventory and longer selling timelines

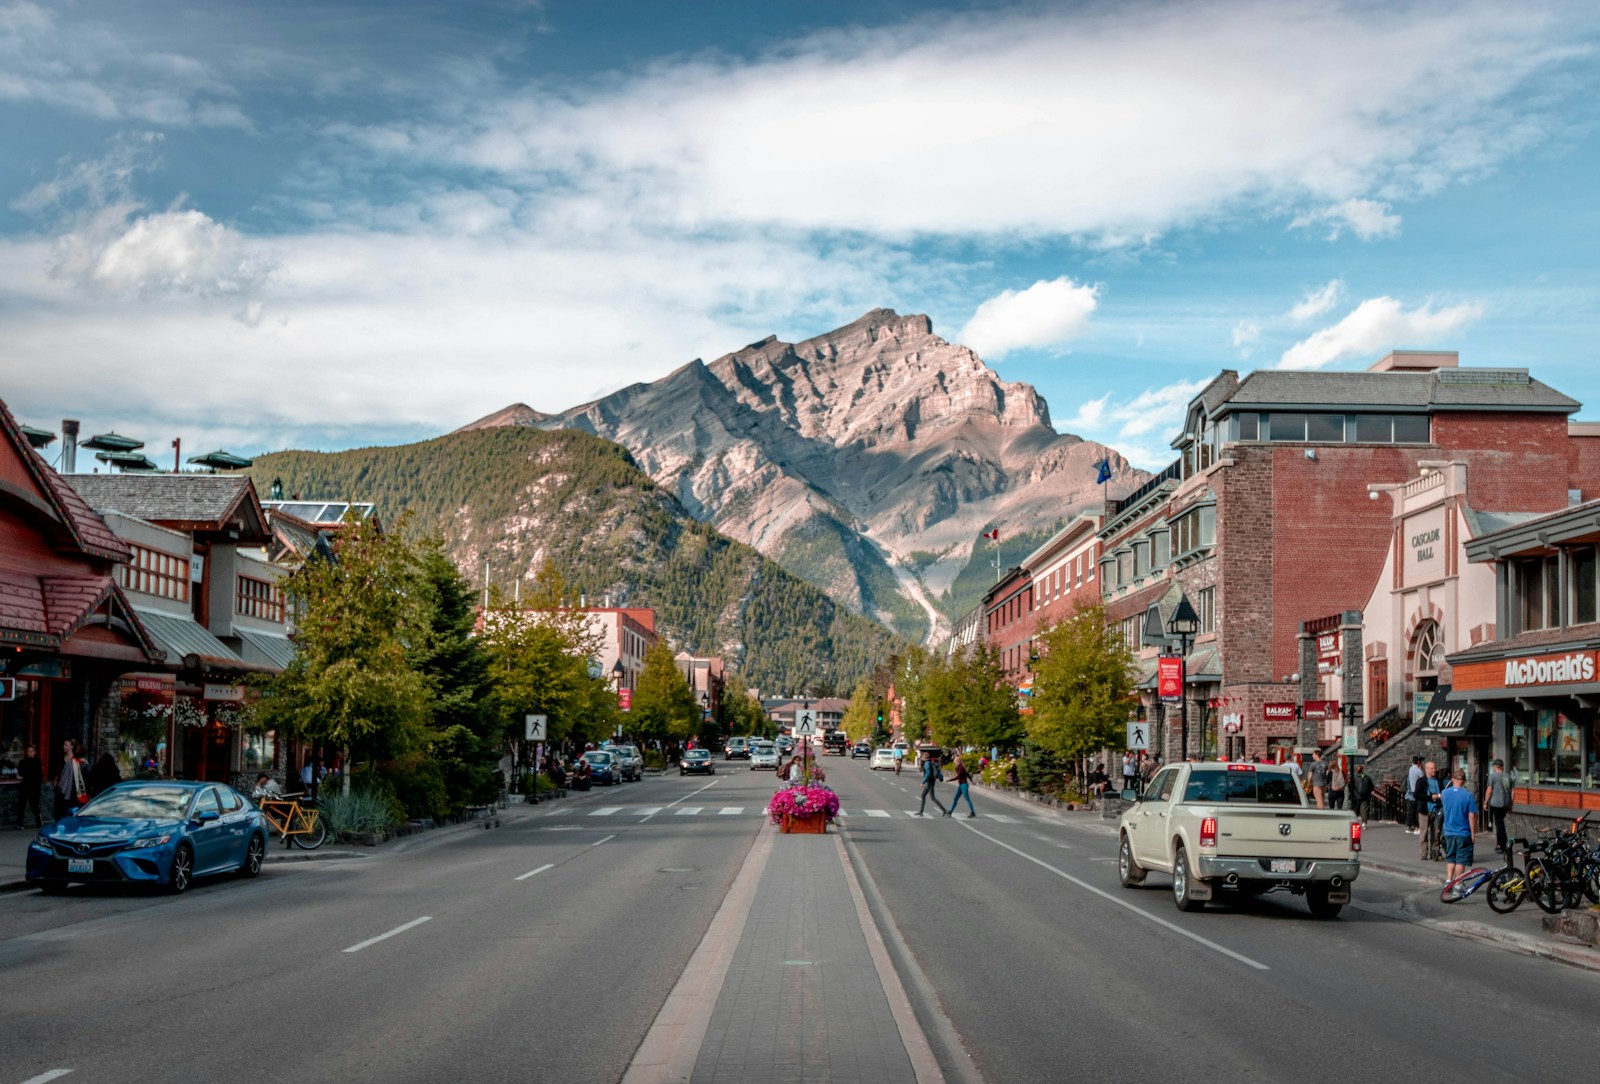
  • Luxury and resort destinations, such as Whistler, remain stable due to constrained supply and long‑term ownership

  • Select Alberta markets, particularly Canmore, are seeing strong growth supported by investor demand

This divergence underscores the importance of local market knowledge when navigating recreational property opportunities.

Sales Activity Remains Resilient, but Highly Selective

Overall sales activity across Western Canada remains resilient. While British Columbia has seen modest sales declines, these are being offset by significant gains in investor‑driven markets, most notably Canmore.

This pattern signals that demand remains present, but buyers are increasingly selective—focusing on quality, usability, and long‑term value rather than speculative purchases.

Buyer Leverage Is Increasing in Several Regions

Buyer leverage has improved in many recreational markets, particularly where lifestyle appeal is not the primary purchase driver. Higher inventory levels and longer days on market are giving buyers:

  • More choice

  • Greater negotiating power

  • Increased ability to conduct due diligence

In softer BC markets, elevated supply and slower absorption are reshaping the buyer‑seller dynamic, while constrained inventory continues to limit leverage in high‑demand destinations like Whistler and Canmore.

Demand Is Strong, but Buyer Behaviour Has Changed

Fundamental demand for recreational property remains strong across Western Canada. However, buyers are now:

  • More value‑conscious

  • Highly selective

  • Focused on quality, condition, and functionality

Turn‑key properties have become the baseline expectation across nearly all markets, with limited appetite for renovations or major upgrades.

Buyer Profiles Vary Sharply by Market

A clear divide has emerged in buyer profiles across Western Canada’s recreational regions:

  • Families and lifestyle‑driven buyers dominate more affordable markets

  • Investors and high‑net‑worth buyers are concentrated in premium destinations

Buyer motivations are similarly split. While lifestyle use remains a key driver, income generation plays a significant role in certain markets—most notably Canmore, where investment‑focused demand is strongest.

Recreational Properties Are Being Used in New Ways

Usage patterns continue to evolve across Western Canada:

  • In accessible regions such as South Okanagan and Sylvan Lake, recreational properties are increasingly being used as hybrid or primary residences

  • In higher‑priced or regulated markets like Whistler, BC and Canmore, AB, properties remain primarily recreational or investment assets

Remote work still supports demand in secondary markets, but it is no longer a primary growth driver.

Supply Conditions Differ Dramatically by Region

Supply dynamics vary widely across Western Canada:

  • Softer BC markets are experiencing elevated inventory and slower absorption

  • Whistler and Canmore continue to face tight or constrained supply

  • Sylvan Lake is seeing balanced inventory conditions supported by ongoing growth

  • These disparities are reinforcing the multi‑speed nature of the recreational market.

Generational Turnover Is Emerging as a Supply Driver

Generational turnover is becoming an increasingly important source of supply. Aging owners are listing or transferring recreational properties more frequently, particularly in:

  • South Okanagan, BC

  • Sylvan Lake, AB

In contrast, ownership turnover remains limited in high‑demand resort markets such as Whistler, where properties are more often held for long‑term appreciation or rental income.

What This Means for Buyers and Sellers

The Western Canada recreational property market is being reshaped by:

  • Demographic shifts

  • Changing buyer expectations

  • Uneven supply pipelines

  • Regional differences in demand and affordability

For buyers, this environment offers targeted opportunities—especially in regions with growing inventory and improved leverage. For sellers, success increasingly depends on accurate pricing, strong presentation, and understanding local market conditions.

Key Takeaways on Western Canada’s Recreational Property Market

  • Western Canada is a multi‑speed recreational market

  • Demand remains resilient but highly selective

  • Buyer leverage is improving in several regions

  • Turn‑key properties dominate buyer expectations

  • Usage patterns and demographics are driving long‑term change

[Click Here] to access the full REMAX 2026 Recreational Report

Read

Canada’s housing market sees green shoots and stunted growth this spring

There’s a little bit of everything happening in Canada’s housing market as the busiest house hunting season kicks into high gear.

Signs have emerged suggesting slumping markets like Toronto and Hamilton could be finally turning a corner at the same time that previously robust Saskatchewan, Manitoba, parts of Quebec and Atlantic Canada appear to be topping out.

Opposing regional developments have been largely a wash from a national perspective.

The number of homes changing hands was little changed overall at 426,900 units (seasonally adjusted and annualized) in April, edging up 0.7% from March.

This represented the third consecutive month of essentially flat activity— albeit the first one with a slight positive sign in front of it. 

More sellers enter the market 

A common theme across most regions in April was a notable influx of sellers.

New listings rose in two-thirds of urban markets led by Quebec City (12.4% from March), Kitchener-Waterloo (10.5%), Ottawa (10.2%) and Winnipeg (8.2%).

This translated to a 4.1% nationwide increase from March that almost entirely reversed declines earlier this year. 

Buyers have more options to choose from 

Importantly, the seller influx adds to the inventory of homes for sale, especially in Quebec and Nova Scotia where buyers are gaining bargaining power.

Trends were little changed elsewhere, though. Steady but at decade highs in Ontario and British Columbia, gradually building from low levels in Alberta and New Brunswick, and persistently shrinking in Saskatchewan, Manitoba, and Newfoundland and Labrador. 

Price trends continue to diverge 

Home values reflected varied levels from coast to coast. They continue to generally depreciate in B.C. and Ontario, and appreciate in the rest of the country.

That said, April brought a few noteworthy developments. Toronto’s MLS Home Price Index was unchanged from the previous month for the first time in nearly a year. Meanwhile, Calgary and Edmonton’s indexes rose (0.3% and 0.9%, respectively), breaking from year-long strings of declines.

We saw the opposite in Saskatchewan, Montreal, New Brunswick and Nova Scotia, where local indexes dipped last month.

Overall, Canada’s aggregate MLS HPI fell month-over-month for the 15th straight time in April, edging 0.2% lower from March. It was the slowest decline since November, but still down 4.1% from a year ago. 

Price dips in Montreal and Nova Scotia could spell the end of long running ascending trends if supply builds further and activity continues to cool.

We’re more hesitant to call the April price stabilization in Toronto a turning point, given the many hurdles this market still faces. Abundant inventory—especially for condos—is poised to maintain fierce seller competition, and downward price pressure near term. 

Uncertain and uneven outlook 

Canada’s housing market could take different directions from here depending on how the broad macroeconomic landscape unfolds.

Lower prices, improving affordability and better job prospects have the potential to unlock pent-up demand, bring more buyers to market, drain some of the inventory, and put the recovery back on track.

Then, there’s also a risk that persistent gloom arising from geopolitical events, spiking energy prices, and renewed deterioration in the job market prolongs the slump. With interest rates unlikely to fall further and immigration cuts cooling housing demand, a rebound in activity could also be delayed.

The next few months will hopefully bring clarity on the outlook. Meanwhile, we see market trends continuing to diverge across the country, keeping the national picture stagnant at best.

We expect abundant inventory sustaining downward price pressure in Ontario and B.C. near term, while tighter supply-demand support boost modest appreciation in most other regions. 

Courtesy RBC


Read

Balanced conditions in the city, except for apartment-style units

In line with seasonal expectations, both sales and inventory levels trended up relative to March’s activity. Despite this typical monthly rise, April sales totalled 2,104 units, six per cent lower than levels reported in 2025. “Sales were expected to ease this year as our market transitioned away from strong demand that was driven by previously rapid migration growth. Improved supply choice across the entire housing spectrum has reduced the urgency among potential purchasers, helping our market shift away from seller’s market conditions to more balanced conditions,” said Ann-Marie Lurie, CREB®’s Chief Economist. “However, the trend of limited supply choice in the detached market continues, while conditions favour the buyer in the apartment condominium market.”

With 3,829 new listings in April, the sales-to-new-listings ratio remained at 55 percent, supporting a modest monthly gain in supply. Inventory levels reached 5,973 units, nearly two per cent higher than levels reported last April. Overall, the months of supply remained just below three, representing relatively balanced conditions. However, this ranged from just over two months for detached homes to over four months for apartment-style homes.

The unadjusted total residential benchmark price trended up compared with March, reaching $568,800. The monthly gain was mostly associated with seasonal improvements, which is expected heading into the spring market. Monthly gains were higher in the detached and semi-detached segments. Overall, compared with the previous year, prices remain three per cent lower, with modest year-over-year declines in the detached and semi-detached sector, while declines neared nine per cent for apartment-style units.

So far in 2026, conditions have varied, ranging from seller’s market conditions and price growth for detached homes in some parts of the city to buyer’s market conditions and price adjustments in the apartment condominium sector.

Detached

With 1,095 sales and 1,863 new listings, inventory levels reported a modest monthly gain. However, with 2,468 units in inventory, levels remain lower than those reported last year and below long-term trends, while months of supply remained just over two. The tighter conditions helped support prices in April, which continued to rise compared with March, causing the pace of year-over-year price declines to ease to under three per cent. As of April, the unadjusted benchmark price was $745,400.

Within the detached market, conditions varied by district. Calgary’s North West, West and South districts experienced seller’s market conditions, with less than two months of supply, driving stronger monthly price gains. Meanwhile, conditions in the North East favoured the buyer, causing prices to trend down from the previous month. Benchmark price changes in April ranged from a year-over-year decline of eight per cent in the North East to a two per cent increase in the West district.

Semi-detached

Recent improvements in new listings helped to support the rise in sales this month. Year to date, there have been 700 sales and 1,190 new listings, similar to last year’s levels. In April, both the sales-to-new-listings ratio and months of supply remained at the lower end of the balanced range. Conditions supported further monthly price growth, as the unadjusted benchmark price reached $690,000. Gains over the past three months have brought prices to levels only slightly lower than those reported last April.

As in the detached sector, conditions vary by location. In April, prices trended up over March in all districts except the North East and East, which are also reporting higher months of supply. Tighter conditions in other areas supported monthly price gains. Year to date, benchmark prices improved over last year’s levels in the City Centre, North West and West districts.

Row

Sales, new listings and inventory levels all trended over the previous month, in line with seasonal expectations. However, year to date, the pullback in sales has outpaced the pullback in new listings, causing the sales-to-new-listings ratio to average 51 percent and inventories to trend higher than levels reported last year at this time. While inventories have improved, months of supply has remained in a relatively balanced range at nearly three months.

Conditions vary significantly across the city, contributing to differing price trends. The North East district reported the highest months of supply and the steepest year-to-date price adjustments, at over 11 percent. Meanwhile, the smallest year-to-date price adjustments occurred in the West, at less than a two percent decline.

Apartment condominium

The pace of growth in new listings slowed in April relative to the gains in sales, causing the sales-to-new-listings ratio to improve to 46 percent. However, this is not enough to prevent further inventory gains. In April, inventory rose to 1,920 units, nearly three percent higher than last year and 27 percent above long-term trends. With over four months of supply, conditions continue to favour the buyer, preventing any significant upward pressure on prices.

As of April, the unadjusted benchmark price was $301,400, slightly higher than March. Gains were mostly driven by improvements in the North West, South East and West districts, while prices continued to trend down in the North East, North and East districts. Compared with last April, benchmark prices have declined by nearly nine per cent, with the steepest declines in the North East, East, North and South East districts.

REGIONAL MARKET FACTS

Airdrie

Despite seasonal gains, sales in Airdrie eased compared with last year, causing year-to-date sales to decline by nearly 12 percent. While sales have slowed, they remain in line with long-term trends. New listings have also trended down compared with last year, but recent gains supported further increases in inventory. With 494 units in inventory and 151 sales, months of supply remained just above three months. While conditions are not as tight as they were the previous year, they remain relatively balanced and are supporting modest price gains following last year’s decline. The benchmark price reached $516,700 in April, nearly one per cent higher than March, but still more than five per cent lower than last April.

Cochrane

Gains in April sales were enough to push year-to-date sales up by over six per cent. At the same time, new listings eased compared with March, causing the sales-to-new-listings ratio to rise above 70 percent and preventing any significant change in inventory. This also caused months of supply to push below three. While conditions can fluctuate month-to-month, tighter conditions were accompanied by further price gains. In April, the unadjusted benchmark price reached $569,200, more than one per cent higher than the previous month. Recent gains have helped offset some of the pullbacks experienced during the second half of the year, but prices remain over three per cent lower than last April.

Okotoks

Improving sales in April were not enough to offset earlier declines, as year-to-date sales remained three per cent below last year’s. At the same time, new listings continued to improve, helping bring up inventory levels. However, with 149 units available in April, inventory remains well below long-term trends. With two and a half months of supply, conditions remain relatively tight, supporting further price gains. As of April, the unadjusted benchmark price was $627,600, over one per cent higher than March and in line with levels reported last April.

Click here to view the full City of Calgary monthly stats package.

Click here to view the full Calgary region monthly stats package.

Courtesy CREB

Read

Bank of Canada Holds Policy Rate at 2.25% for a Fourth Consecutive Time

Bank of Canada Holds Policy Rate Amid Middle East Conflict and Trade Uncertainty

The Bank of Canada has held its target for the overnight rate at 2.25%, with the Bank Rate at 2.5% and the deposit rate at 2.20%. The ongoing conflict in the Middle East has driven energy prices sharply higher, while U.S. trade policy continues to create uncertainty for the global and Canadian economies.

CPI inflation rose to 2.4% in March and is expected to climb to around 3% in April, largely due to higher gasoline prices. The Bank projects GDP growth of 1.2% in 2026, with inflation expected to return to the 2% target early next year as oil prices ease.Governing Council has chosen to hold the policy rate steady and remains committed to maintaining Canadians’ confidence in price stability through this period of global upheaval.

Bank of Canada’s 2026 Policy Interest Rate Announcement Schedule

Bank of Canada announces its decision for the overnight rate target eight times a year, typically on a Wednesday. The schedule for 2026 is as follows:

  • Wednesday, January 28

  • Wednesday, March 18

  • Wednesday, April 29

  • Wednesday, June 10

  • Wednesday, July 15

  • Wednesday, September 2

  • Wednesday, October 28

  • Wednesday, December 9

Read the full interest rate announcement below:

The Bank of Canada today held its target for the overnight rate at 2.25%, with the Bank Rate at 2.5% and the deposit rate at 2.20%.

The evolving conflict in the Middle East is causing heightened volatility and US trade policy continues to reshape global trade patterns. Both are ongoing sources of uncertainty. The Bank’s April outlook assumes tariffs remain unchanged and the global benchmark price of oil declines to US$75 per barrel by mid 2027.

The Iran war has led to sharply higher energy prices and transportation disruptions, diminishing growth prospects in oil-importing countries and boosting inflation worldwide. In the United States, growth is still expected to be solid over the projection horizon, boosted by AI-related investment and consumption growth. China’s economy is being supported by robust exports. In the euro area, higher prices for oil and natural gas will weigh on economic activity.

Financial conditions have been volatile, reflecting daily developments in the Middle East and shifting market expectations for inflation and interest rates. Bond yields are modestly higher since January while equity markets, which weakened sharply at the outset of the war, have recovered. Since the start of the war, the US dollar has appreciated against most major currencies. The Canada-US exchange rate has been relatively stable.

Overall, the global economy is expected to grow by about 3% in 2026, 2027 and 2028. Projections for inflation over the next year are revised up because of the jump in energy prices.

The outlook for economic growth in Canada is little changed from the January Monetary Policy Report (MPR) projection. After a contraction in the fourth quarter of 2025, growth is forecast to have resumed in early 2026. Consumer and government spending are supporting economic activity, while tariffs and trade uncertainty are weighing on exports and business investment. Housing activity declined in the fourth quarter and is being held back by slow population growth, economic uncertainty and ongoing affordability issues. The labour market is soft, with subdued employment growth over the past year and job losses in sectors targeted by US tariffs. The unemployment rate remains in the 6½%‑7% range, reflecting both weak hiring and fewer job seekers.

The Bank’s April forecast projects GDP growth of 1.2% in 2026, rising to 1.6% in 2027 and 1.7% in 2028 as growth in exports and business investment resumes along a lower trajectory. With GDP growing slightly above potential, the current excess supply in the economy is gradually absorbed. While the war in Iran may alter its composition, overall GDP growth is little changed in the updated forecast: Since Canada is a large net exporter of oil, higher oil prices increase national income even as consumers are squeezed by higher gasoline prices.

CPI inflation climbed to 2.4% in March because of sharply higher gasoline prices. The March increase follows several months of slowing inflation data. Core inflation has been easing and held steady at just above 2% in the most recent inflation report. The proportion of components of the CPI basket rising above 3% has also declined in recent months. As expected, so far there is little evidence that oil prices have fed through more broadly to goods and services prices, but this warrants close attention in the months ahead. Near-term inflation expectations have moved up with higher gasoline prices and still-elevated food price inflation, but longer-term inflation expectations have remained anchored.

CPI inflation will likely rise further in April to about 3%. Based on the assumption that oil prices will ease, inflation is forecast to come down to the 2% target early next year and remain around 2% over the projection horizon.

Against this backdrop and taking into account the current projection, Governing Council decided to maintain the policy rate at 2.25%. We are closely monitoring the impact of the conflict in the Middle East and how the economy is responding to US tariffs and trade policy uncertainty. Governing Council is looking through the war’s immediate impact on inflation but will not let higher energy prices become persistent inflation. As the outlook evolves, we stand ready to respond as needed. The Bank is committed to maintaining Canadians’ confidence in price stability through this period of global upheaval.

Courtesy REMAX LLC


Read
Data is supplied by Pillar 9™ MLS® System. Pillar 9™ is the owner of the copyright in its MLS®System. Data is deemed reliable but is not guaranteed accurate by Pillar 9™.
The trademarks MLS®, Multiple Listing Service® and the associated logos are owned by The Canadian Real Estate Association (CREA) and identify the quality of services provided by real estate professionals who are members of CREA. Used under license.