FEBRUARY 2024 HOUSING MARKET UPDATE
March 1, 2024
Low inventory and high demand drive price gains in February
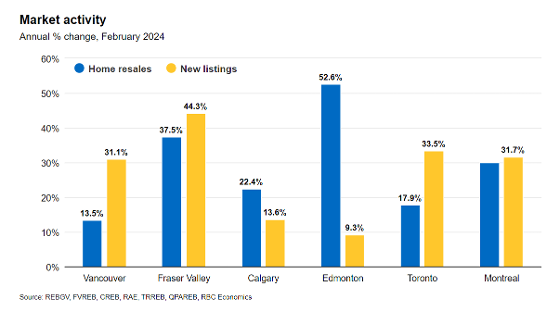
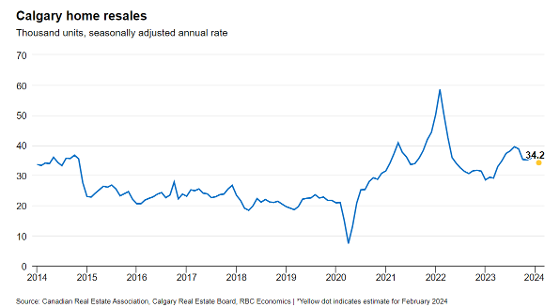
New listings continued to rise in February, reaching 2,711 units. However, the rise in new listings supported further growth in sales, which increased by nearly 23 per cent compared to last year for a total of 2,135 units. The shift in sales and new listings kept the sales-to-new listings ratio exceptionally high at 79 per cent, ensuring inventories remained near historic lows. Low supply and higher sales caused the months of supply to fall to just over one month, nearly as tight as levels seen during the spring of last year.
“Purchasers are acting quickly when new supply comes onto the market, preventing inventory growth in the market," said Ann-Marie Lurie, Chief Economist at CREB®. “It is this strong demand and low supply that continues to drive price gains in Calgary. The biggest supply challenge is for homes priced under $500,000, which saw inventories fall by 31 per cent compared to last February. At the same time, we are starting to see supply levels rise for higher priced homes supporting more balanced conditions in the upper end.”
In February, the unadjusted detached benchmark price was $585,000, an over two per cent gain compared to last month and over 10 per cent higher than levels reported at this time last year. Our most affordable East district is experiencing the highest year-over-year price growth at 25 per cent, while the relatively better-supplied City Centre has reported the slowest price growth in the city at under five per cent.
Detached
In February, 1,195 new listings came onto the market, of which 75 per cent were priced over $600,000. While new listings did improve over last month in line with seasonal expectations, levels are still below typical levels for February. At the same time, sales in February rose to 954 units, a year-over-year gain of 20 per cent. The growth in sales was driven by where we saw listings growth, but with a sales-to-new listings ratio of nearly 80 per cent, inventory levels were near record lows for February.
Exceptionally tight market conditions drove further price growth. In February, the unadjusted detached benchmark price rose to $721,300, nearly three per cent higher than last month and over 13 per cent higher than last February. While prices rose across every district, the most significant year-over-year gains occurred in the North East and East districts.
Semi-Detached
Last month’s rise in listings compared to sales was short-lived, as the 223 new listings this month were met with 191 sales, driving up the sales-to-new-listings ratio to 86 per cent. This prevented any significant change to the low inventory situation and caused the months of supply to fall to just over one month.
In February, the unadjusted benchmark price reached $639,100, a monthly gain of over two per cent and 13 per cent higher than last year. Year-over-year price gains ranged from a low of 10 per cent in the City Centre to over 26 per cent in the East district.
Row
New listings rose to 457 units in February, contributing to the year-to-date increase in new listings of 22 per cent. The rise in new listings supported sales growth, preventing any significant change to the low inventory situation. For the second consecutive month, the months of supply were below one month.
The exceptionally tight market conditions have contributed to strong price growth for row properties. In February, the unadjusted detached price reached $436,500, over 2 per cent higher than last month and nearly 19 per cent higher than levels reported last February. Prices rose across all districts, with the highest growth occurring in the most affordable districts.
Apartment Condominium
Sales in February reached 638 units, contributing to the year-to-date sales increase of 39 per cent. Relative affordability has supported the strong demand for apartment-style homes, and sales growth has been possible thanks to the continued growth in new listings. Inventory levels trended up over the last month in line with seasonal expectations. However, inventory levels declined by 12 per cent compared to last year, ensuring the market continued to favour the seller with just over one month of supply.
Persistently tight conditions continued to place upward pressure on home prices. Prices have steadily increased since January of last year, and as of February, they reached $329,600, a 17 per cent gain over last February. Prices rose across every district in the city, with year-over-year gains surpassing 19 per cent in all districts except the City Centre, which reported a year-over-year gain of 13 per cent.
REGIONAL MARKET FACTS
Airdrie
New listings in Airdrie improved in February. However, with 182 new listings and 135 sales, the sales-to-new listings ratio remained high, and inventory levels eased over last year's low levels. Inventory levels are half what we typically see in February and have not been this low since 2006.
The rise in sales compared to inventory levels caused the months of supply to drop to just over one month. Airdrie has struggled with limited supply over the past several years, driving home prices. In February, the unadjusted benchmark price reached $529,700, over one percent higher than last month and 10 per cent higher than the $479,700 price reported last February.
Cochrane
New listings rose to 105 units in February, the highest monthly total seen since July last year and contributing to the year-to-date gain of 22 per cent. At the same time, February sales improved over last year, with 65 sales.
With a sales-to-new listings ratio of 62 per cent, we did see some growth in inventory levels compared to last year. However, inventories remain well below what is typical for this market. Nonetheless, the months of supply remained relatively low for this market at two months, supporting further price growth in the town. As of February, the unadjusted benchmark price reached $548,300, an improvement over last month and over 11 per cent higher than levels reported last year.
Okotoks
For the second month in a row, new listings improved in Okotoks compared to last year. However, as sales also improved over the past two months, inventory levels in February remained stable compared to last month and only slightly higher than last year’s levels. Inventory levels are near record lows for the month and are 63 per cent below long-term trends.
Okotoks has struggled to add enough supply to keep pace with demand, keeping conditions tight and driving home prices. As of February, the unadjusted benchmark price reached $605,500, nearly three per cent higher than last month and a 10 per cent gain over last year at this time.
Click here to view the full City of Calgary monthly stats package.
Click here to view the full Calgary region monthly stats package.


